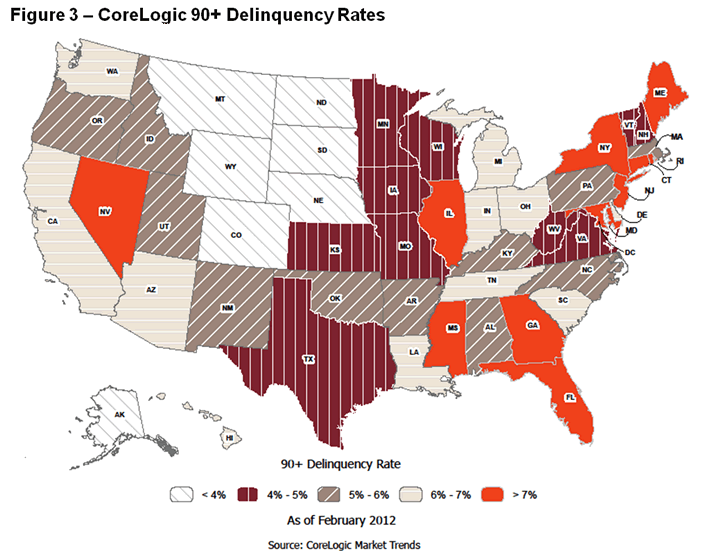
 The St Louis foreclosure rate was 1.7 percent for February 2012, the same rate as a year before according to newly released data from CoreLogic. As usual, the St Louis foreclosure rate is significantly lower than the national foreclosure rate, which was 3.4 percent in February 2012.
The St Louis mortgage delinquency rate, the precursor to foreclosures, also remained flat in February from the year before at 5.0 percent.? Like the foreclosure rate, the St Louis mortgage delinquency rate is also significantly below the national mortgage delinquency rate which was 7.3 percent in February.
?
| CBSA | February-2012 | ||||
|---|---|---|---|---|---|
| 90+ Delinquent | 90+ Delinquent Pct. Point Change from a Year Ago | Foreclosure Inventory | Foreclosure Inventory Pct. Point Change from a Year Ago | Completed Foreclosures (12 months ending Feb 2012) | |
| Chicago-Joliet-Naperville, IL | 10.7% | 0.3% | 6.3% | 0.5% | 15,054 |
| Los Angeles-Long Beach-Glendale, CA | 7.0% | -2.2% | 2.5% | -0.6% | 26,564 |
| Atlanta-Sandy Springs-Marietta, GA | 8.8% | -0.9% | 2.6% | -0.4% | 40,452 |
| New York-White Plains-Wayne, NY-NJ | 8.8% | 0.2% | 5.5% | 0.4% | 851 |
| Washington-Arlington-Alexandria, DC-VA-MD-WV | 5.9% | -0.8% | 2.3% | -0.1% | 7,137 |
| Houston-Sugar Land-Baytown, TX | 5.2% | -0.3% | 1.6% | -0.1% | 17,071 |
| Phoenix-Mesa-Glendale, AZ | 7.1% | -4.0% | 2.7% | -1.9% | 48,115 |
| Riverside-San Bernardino-Ontario, CA | 9.7% | -3.7% | 3.4% | -1.2% | 30,856 |
| Dallas-Plano-Irving, TX | 5.1% | -0.1% | 1.5% | -0.1% | 11,868 |
| Minneapolis-St. Paul-Bloomington, MN-WI | 4.8% | -0.8% | 1.8% | -0.4% | 12,280 |
| Philadelphia, PA | 5.8% | 0.3% | 2.7% | 0.2% | 4,040 |
| Seattle-Bellevue-Everett, WA | 6.5% | 0.1% | 1.5% | -0.8% | 8,734 |
| Denver-Aurora-Broomfield, CO | 4.2% | -0.7% | 1.4% | -0.5% | 10,765 |
| San Diego-Carlsbad-San Marcos, CA | 5.7% | -1.9% | 2.0% | -0.4% | 9,708 |
| Tampa-St. Petersburg-Clearwater, FL | 17.2% | 0.0% | 12.3% | 0.6% | 10,649 |
| Santa Ana-Anaheim-Irvine, CA | 5.2% | -1.5% | 2.0% | -0.3% | 6,804 |
| Baltimore-Towson, MD | 7.9% | 0.6% | 3.0% | 0.4% | 1,389 |
| St. Louis, MO-IL | 5.0% | 0.0% | 1.7% | 0.0% | 9,305 |
| Oakland-Fremont-Hayward, CA | 6.1% | -2.2% | 2.2% | -0.6% | 11,717 |
| Nassau-Suffolk, NY | 10.5% | 0.3% | 6.6% | 0.9% | 684 |
| Warren-Troy-Farmington Hills, MI | 5.6% | -1.7% | 1.8% | -0.9% | 15,399 |
| Portland-Vancouver-Hillsboro, OR-WA | 5.5% | -0.2% | 2.4% | 0.1% | 6,036 |
| Sacramento?Arden-Arcade?Roseville, CA | 7.2% | -2.6% | 2.6% | -0.8% | 15,464 |
| Edison-New Brunswick, NJ | 9.0% | 1.1% | 5.4% | 0.5% | 481 |
| Orlando-Kissimmee-Sanford, FL | 18.1% | -1.3% | 12.3% | -0.5% | 9,922 |
Source: CoreLogic Feb 2012

Related posts:
- Mortgage delinquencies increase in November; ? Foreclosures decline from month before
- Mortgage delinquencies continue to decline; good news for the real estate market!
- Mortgage delinquencies decline in October; ? Foreclosures on the rise
- St. Louis Foreclosures and Mortgage Delinquencies Hit Record Levels in March
- Foreclosures in St. Louis Increase 50 Percent in July from a Year Ago; Mortgage Delinquencies Follow Suit
smash kate upton sports illustrated outback chaka khan taylor swift safe and sound delilah nevis
No comments:
Post a Comment
Note: Only a member of this blog may post a comment.